By Jenny Rea, Ph.D.
As we begin a new year in supporting military families, it’s important to look back on previous years and reflect on the makeup of service members and their families, and how these demographics have shifted. Fortunately, the Department of Defense (DoD) regularly publishes reports on the size and composition of active duty (AD) and reserve members and their families, as well as their geographic location.
The 2020 Demographics Report, published by the U.S. Department of Defense through its Office of the Deputy Assistant Secretary of Defense for Military Community and Family Policy, provides a comprehensive profile of the military family community and is an essential reference source. We’ve highlighted a few items from the report below.
Active Duty
One of the biggest takeaways from the report is that the size of the AD military force has remained stable, and has continued to grow in recent years. Since 2019, the total for AD personnel has grown roughly by 8,000. Of the total 3.5 million military personnel, approximately 1.33 million are AD, with the Army having the most personnel (up by 1,500 since 2019) followed by the Navy, Air Force (including the Space Force), and Marine Corps.
The table below provides a quick breakdown of trends from 2000 to 2020 for the number of AD personnel by service branch.
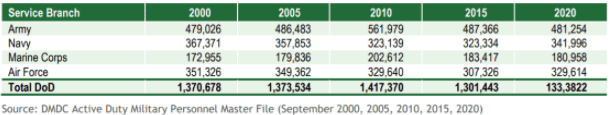
[Number of Active Duty Personnel by Service Branch Trends: 2000-2020, Chart 2.07, p. 14]
Additional AD personnel highlights:
-
-
- Women represent 17.2% of AD personnel. The percentage of both AD enlisted and officers who are women has increased since 2010 (by 2.8% and 3.2%, respectively).
- Approximately, one-third (31.1%) of AD personnel identify themselves as a racial minority group (i.e., Black or African American, Asian, American Indian or Alaska Native, Native Hawaiian or Other Pacific Islander, Multi-racial, or Other/Unknown). From 2015 to 2020, the percentage of enlisted members who identified as a racial minority group decreased (by 0.6%), while the percentage of officers increased (by 1.4%).
-
The Ready Reserve – Specifically, the Selected Reserve
The Ready Reserve (RR) includes the Selected Reserve (SR), the Individual Ready Reserve (IRR), and the Inactive National Guard (ING). IRR and ING members typically have served as AD or SR members in the past, but do not currently participate in organized training. SR members train throughout the year and participate annually in AD training exercises. Because the 2020 Demographics report provided more detailed findings on the SR, this blog post focuses specifically on the SR.
The SR consists of 802,248 members within seven components. Although the SR is roughly 6% smaller than it was in 2010; the Army National Guard continues to have the largest number of members (up 156 since 2019).
The table below provides a quick breakdown of the SR by Reserve component for 2020.
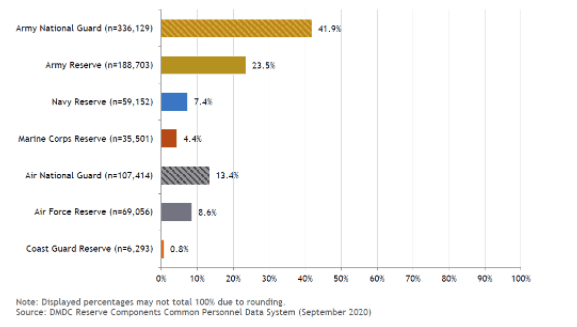
[Selected Reserve Personnel by Reserve Component (N = 802,248), Chart 3.06, p. 54]
Additional SR highlights:
-
-
- Women represent 21.1% (169,675) of the SR. Similar to the AD component, both the percentage of SR enlisted members and SR officers who are women has increased since 2010 (by 3.5% and 2.0%, respectively).
- Approximately, one-quarter (27.5%) of the SR identify themselves as a racial minority group. In the past 10 years, the racial minority representation in the SR for both enlisted personnel and officers has increased (by 3.8% and 3.1%, respectively).
-
Military Families
Across both populations of AD and the SR, there is fewer military personnel than their associated family members (1.57 million and 1.02 million, respectively), including spouses, children, and adult dependents.
AD family highlights:
-
-
- Just under half (49.9%) are married, which is lower than in 2010 (56.4%).
- More AD officers (66.4%) are married compared to enlisted members (46.4%).
- Over half (51.2%) of males and nearly one-half (44%) of females are married, with roughly 7% in dual-military marriages.
- In 2020 alone, 3.1% of enlisted personnel and 1.6% of officers are estimated to have divorced.
- Nearly one-half (46.1%) of AD members are single with no children, and 31.9 percent are married with children; with the largest group of children between birth and 5 years (399,176 or 41.4%).
-
SR family highlights:
-
-
- Just under half (43.9%) are married, with a majority of officers married (69.0%) compared with enlisted members (38.8%).
- Almost half (46.6%) of males and about one-third (33.8%) of females are married, and roughly 3% are in dual-military marriages.
- In 2020 alone, 2.9% of enlisted personnel and 1.8% of officers are estimated to have divorced.
- Nearly 32% of SR members are married with children, and 8.6% are single parents; with the largest group of children between the ages of 6 and 11 years (213,538 or 32.2%).
-
The table below provides a summary of information for AD and SR members and their families on a number of key demographic items.
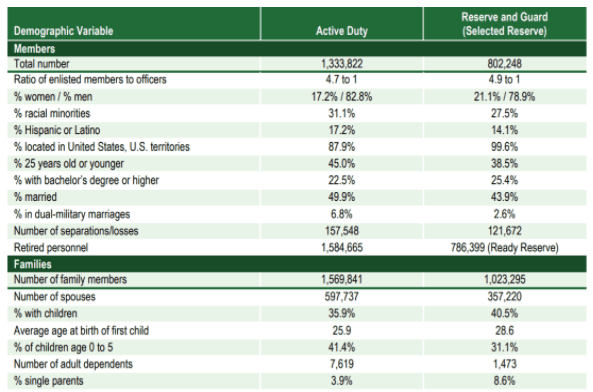
[Active Duty and Reserve Guard Summary Table, p. vii]
This is important to note as it reflects that our military community is larger than what the reports state – reflecting a need to not only assist AD and SR military personnel and their families, but the growing veteran population as well. Information on the shifts in demographics is essential to addressing the needs of our military families. This blog post has briefly scuffed the surface of the information offered in the 2020 Demographics Report; thus, we encourage you to explore further.
Interested in last year’s demographics? Check out this blog post on the 2019 DoD Demographics Report written by our colleagues in Military Caregiving.
Reference
United States Department of Defense, Office of the Deputy Assistant Secretary of Defense for Military Community and Family Policy. (2020). 2020 Demographics Profile. Military OneSource. Retrieved from https://www.militaryonesource.mil/data-research-and-statistics/military-community-demographics/2020-demographics-profile/
 Jenny Rea, Ph.D., is a military spouse and mom of four kiddos under six years. Jenny consults with OneOp and is an Assistant Professor of Practice in the Department of Human Services and Director of the Certificate in Military Families at the University of Arizona.
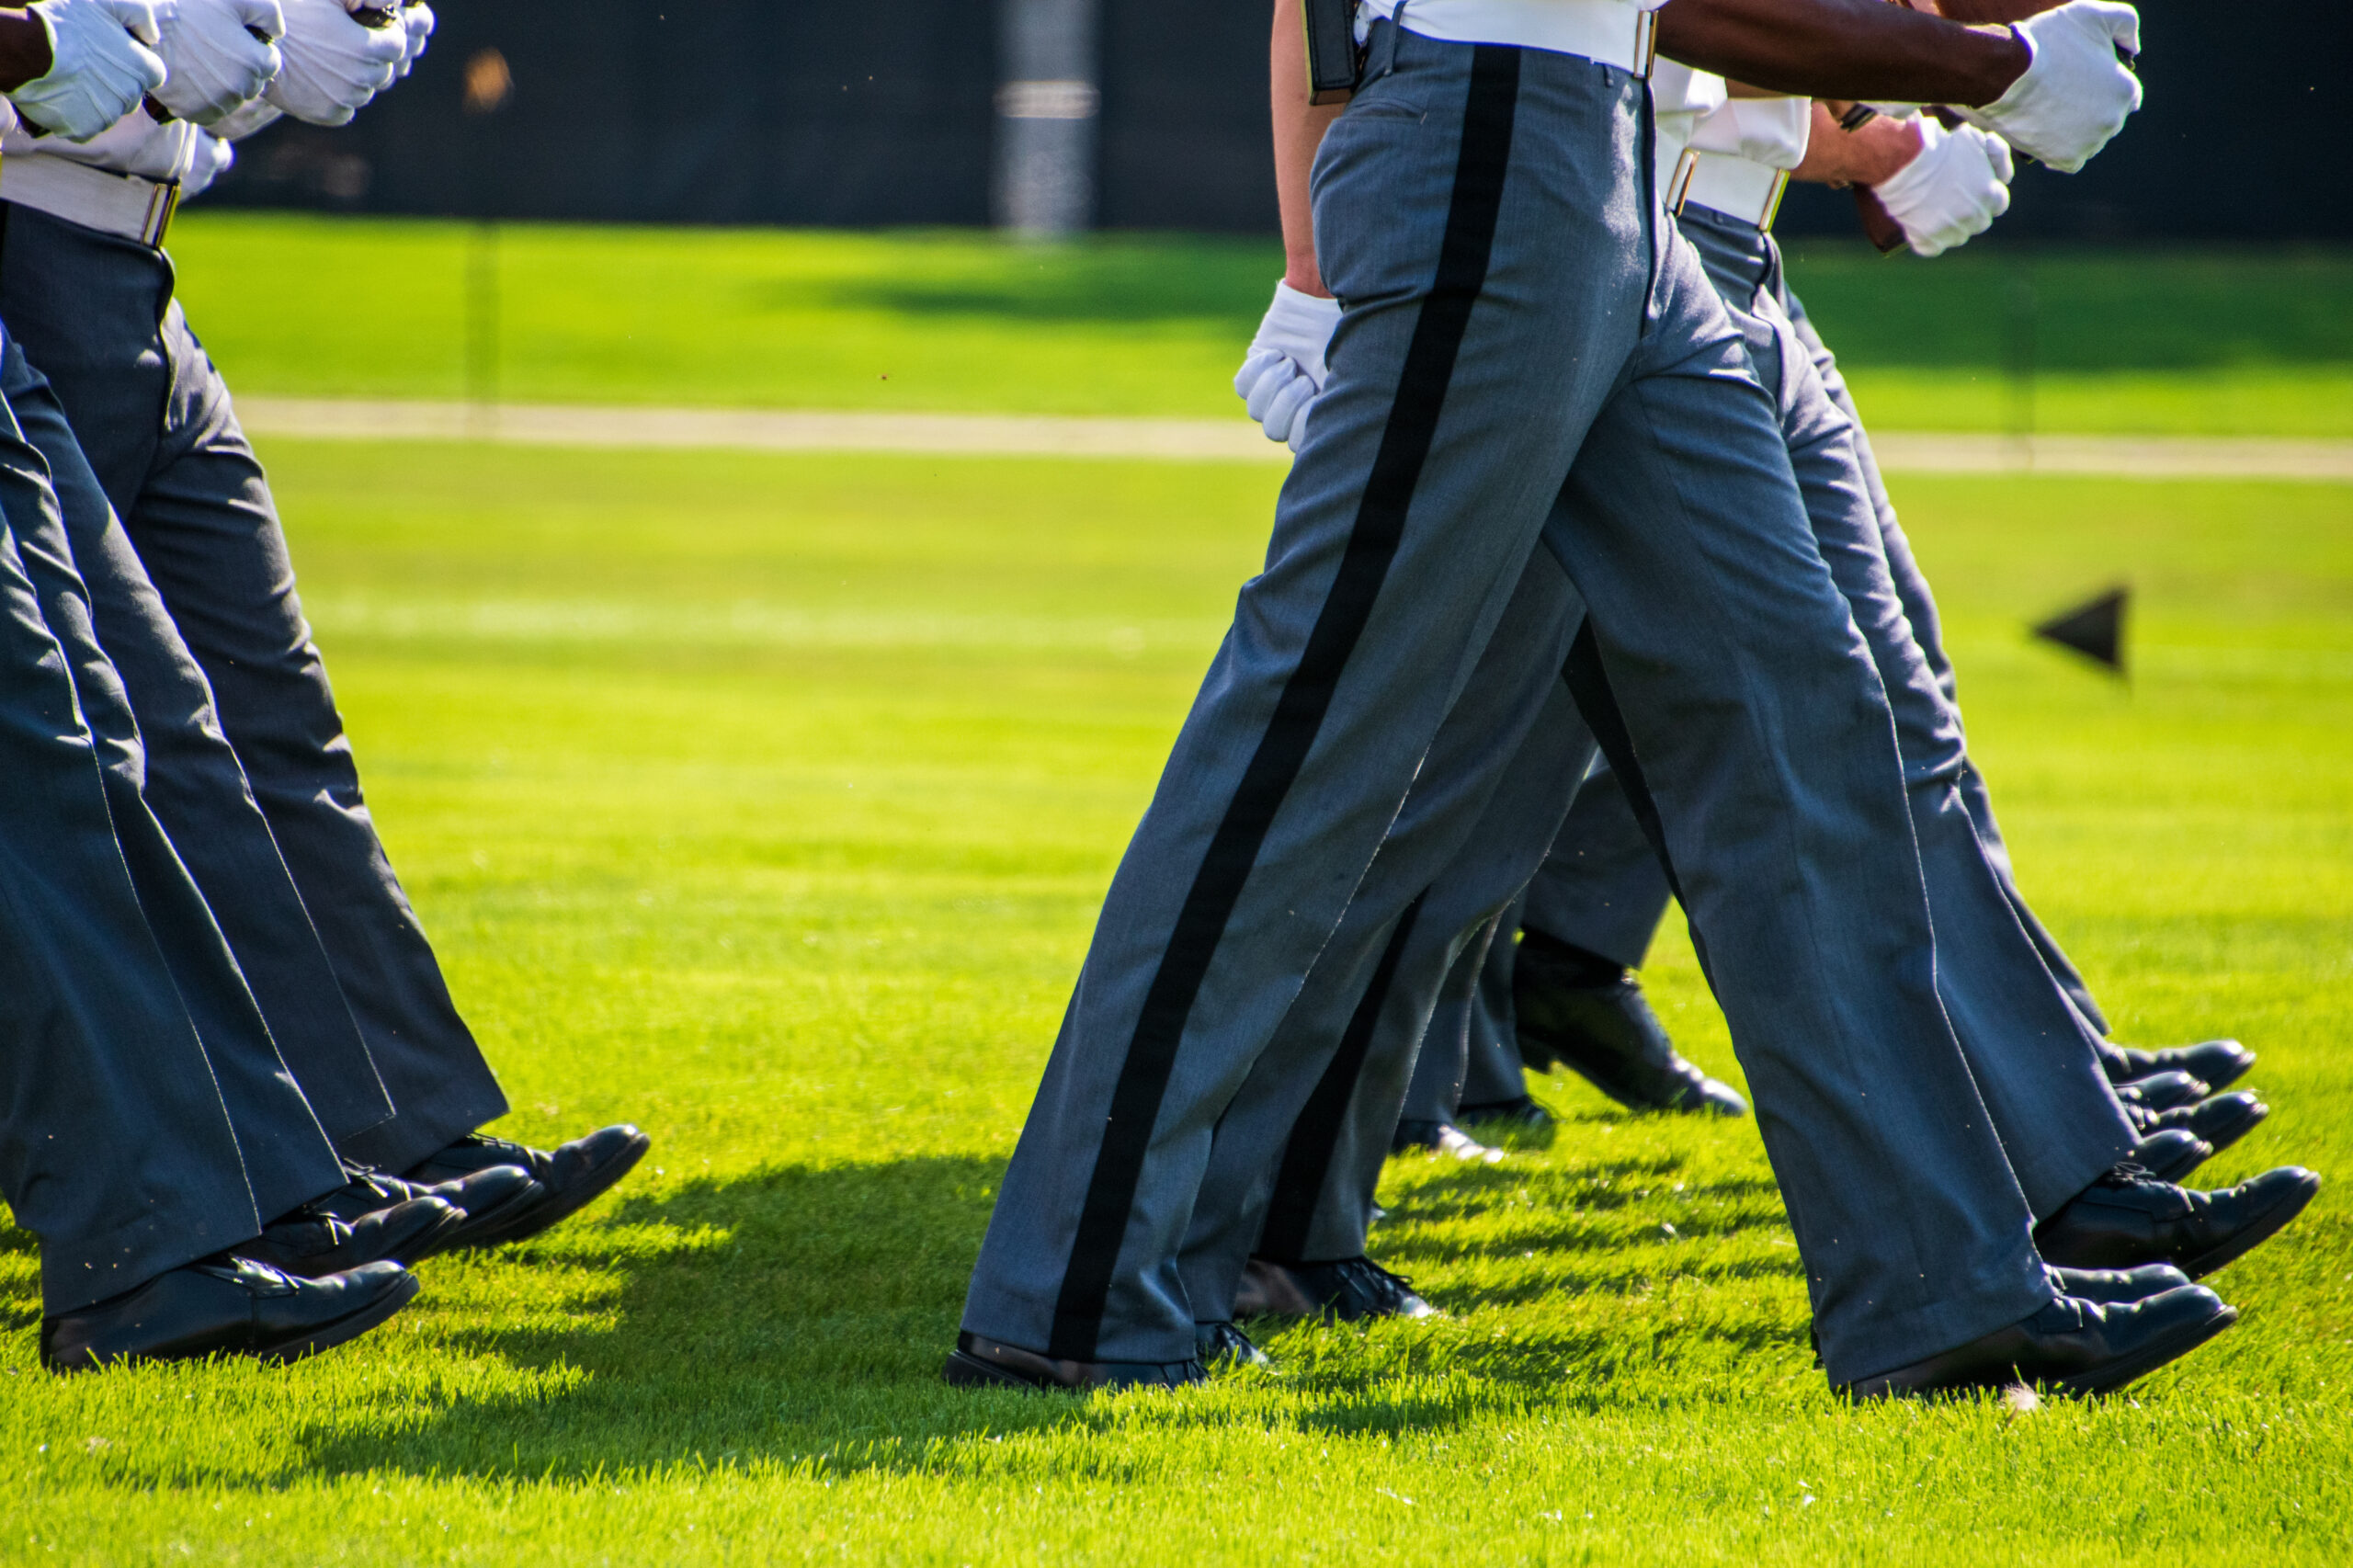
Photo source: Adobestock